Here are the inflation rates since 2008 based on the CPI (Consumer Price Index):
2008 215.3 3.8%
2009 214.5 -0.4%
2010 218.1 1.6%
2011 224.9 3.2%
2012 229.6 2.1%
2013 233.5 1.7% (Source: Federal Reserve) 2013 is an estimate as the final numbers are in yet.
Here's a graph of more years: (Source: US Government - Wikipedia doesn't specify which part of the US Gov.)
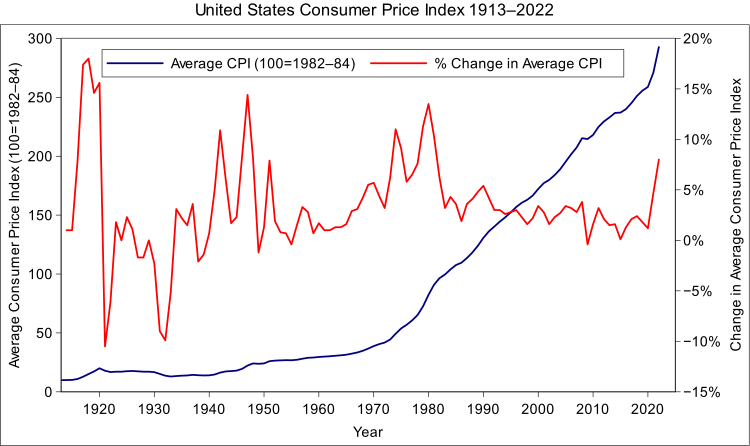
The middle number in the three columns at the top is expressed in dollars. So if a basket of things cost $215.30 dollars in 2008 the same basket of things should cost $233.50. The next question is: "What's in the CPI?" You can read about it here:
http://www.minneapolisfed.org/community_education/teacher/calc/ Basically, it's everything. There is also a number that political types toss around which is called the Core Inflation Rate, which doesn't include Fuel, Food or Housing. I find that number to basically be not only useless it is often used for such egregious political motives that it's worse than useless. I won't bother you with it now. You can read about Core Inflation here:
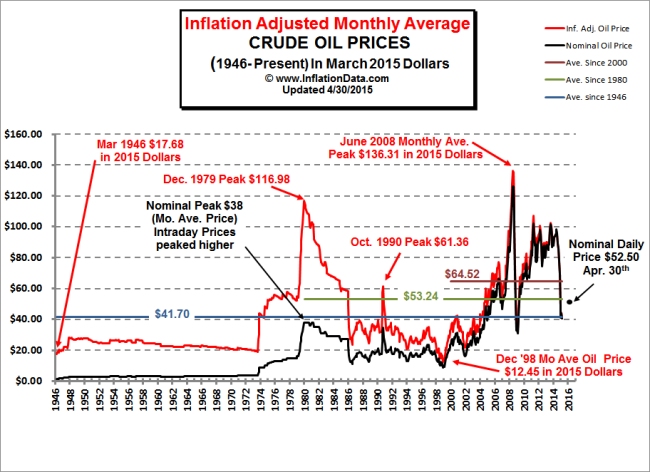
http://en.wikipedia.org/wiki/Core_inflationThe next question is: "How have Fuel, Food and Housing faired compared to this general inflation?" Well, the reason that the Core Inflation number removes these three things is that they are highly volatile and will cause the CPI to jump up and down a lot. The reasoning is that one doesn't buy a house every day, and reasonable buyers will buy when prices are low, so reporting a volatile number like the cost of houses will erroneously drive the CPI way up and way down. We've certainly lived through that recently. Suffice it to say that from 2008 to about 2011 housing price went down a LOT. Even in up-beat real estate markets like San Francisco, where housing has gone up almost 25% this year alone, housing went down by about 35-40 percent in 2008. Fuel, on the other hand has gone up and stayed up. In 2007 I was planning for $50/barrel as a floor price for energy deals I was working on. It has stayed well above that floor. Don't confuse the spot price for oil - oil that is bought on the margin at the last minute - with the average oil price reported in the table below. The spot price makes headlines, but only a complete idiot would pay spot for a commodity you know you're going to buy. The average oil price is as follows:
Year Price Inflation adjusted price2008 $91.48 $98.58
2009 $53.48 $57.92
2010 $71.21 $76.01
2011 $87.04 $90.08
2012 $86.46 $87.68
2013 $87.13 $87.52 (Source: US Fed)
So, you can see that oil (inflation adjusted) is actually down from $98.58/barrel to $87.52/barrel. Do remember that this is oil, not gasoline. The price of gasoline is influenced strongly by local refining capacity, taxes (which have been going up a lot), transportation costs, etc.... But, do have a look at what the average price of oil did in 2009. That's what happens when the economy shuts down and there's no demand.
Again, here's a graph with more years in it. You'll notice right away that the inflation adjusted price today is almost the middle of the range from the '80s. But that during the '90s and the '00s we had oil that was basically at the same price it had always been. There's a lot of debate about what's keeping oil prices so high right now, it isn't shortage. We have FAR MORE oil than we can use.
I don't have graphs for food, like these. But it's safe to say that while prices on things "feel" higher, they actually aren't much higher. We all have our favorite items that have gone up. But, as Derek pointed out, a lot of other things (computers, TVs etc...) have gone way down. The most significant driver of this has been the movement of manufacturing out of high cost places like Detroit and into low cost places like Viet Nam. This sucks if you're a worker in Detroit, but it's great if your an auto buyer in Portland OR.
BV
) .


